
Project Objective & Strategic Business Questions
The primary objective of this project is to assist the Customer Growth Team in analyzing bike-share usage trends across customer segments, starting/ending stations, weather conditions, and seasonal variations to inform growth strategies for the upcoming business year.
The analysis targets two core strategic outcomes:
✓ Station Network Expansion: Does Cyclistic need to expand its network of bike stations, and if so, in which targeted locations?
✓ Customer Segment Optimization: How does service consumption differ between annual Subscribers and non-subscribing Customers, and how should marketing strategies evolve to maximize user engagement and profitability?
Data Quality Assessment (ROCCC Framework)
The case study leverages four primary data sources:
✓ NY Citi Bike Trips Dataset
✓ U.S. Census Bureau Boundary Data
✓ GSOD (Global Surface Summary of the Day) Weather Data
✓ Course-provided ZIP Code Reference Table
Evaluating Data Integrity via ROCCC:
✓ Reliability: High. Data originates from reputable sources and is unlikely to contain significant bias.
✓ Originality: High. Published directly by public municipal and federal authorities, ensuring authenticity.
✓ Comprehensiveness: Good. Provides all necessary dimensions (trips, geography, weather) required to evaluate the business problem.
✓ Currentness: Moderate to Low. Data covers July 2014 through May 2018, which presents historical rather than real-time conditions.
✓ Citation: Fully cited and sponsored by official data-collecting agencies.
BI Framework Execution
The workflow followed the three-stage BI lifecycle: Collect, Analyze, and Monitor.
Collect Phase
✓ Defined key stakeholder objectives and established requirement documentation.
✓ Identified and ingested necessary datasets into Google BigQuery.
Analyze Phase
✓ Conducted initial exploratory data analysis in R to verify column data types and range distributions.
✓ Executed SQL queries in Google BigQuery to filter and join four disparate tables, aggregating trip records by neighborhood and borough.
✓ Technical Adjustment: The original multi-year dataset (~5 million rows spanning 2018–2022) caused file export limits; the data scope was narrowed down to a representative one-year period to optimize query processing.
Monitor Phase
✓ Modeled merged dataset exports into interactive dashboards using Tableau to visualize metrics and enable data-driven decision-making for business leadership.
Analytical Insights & Observations
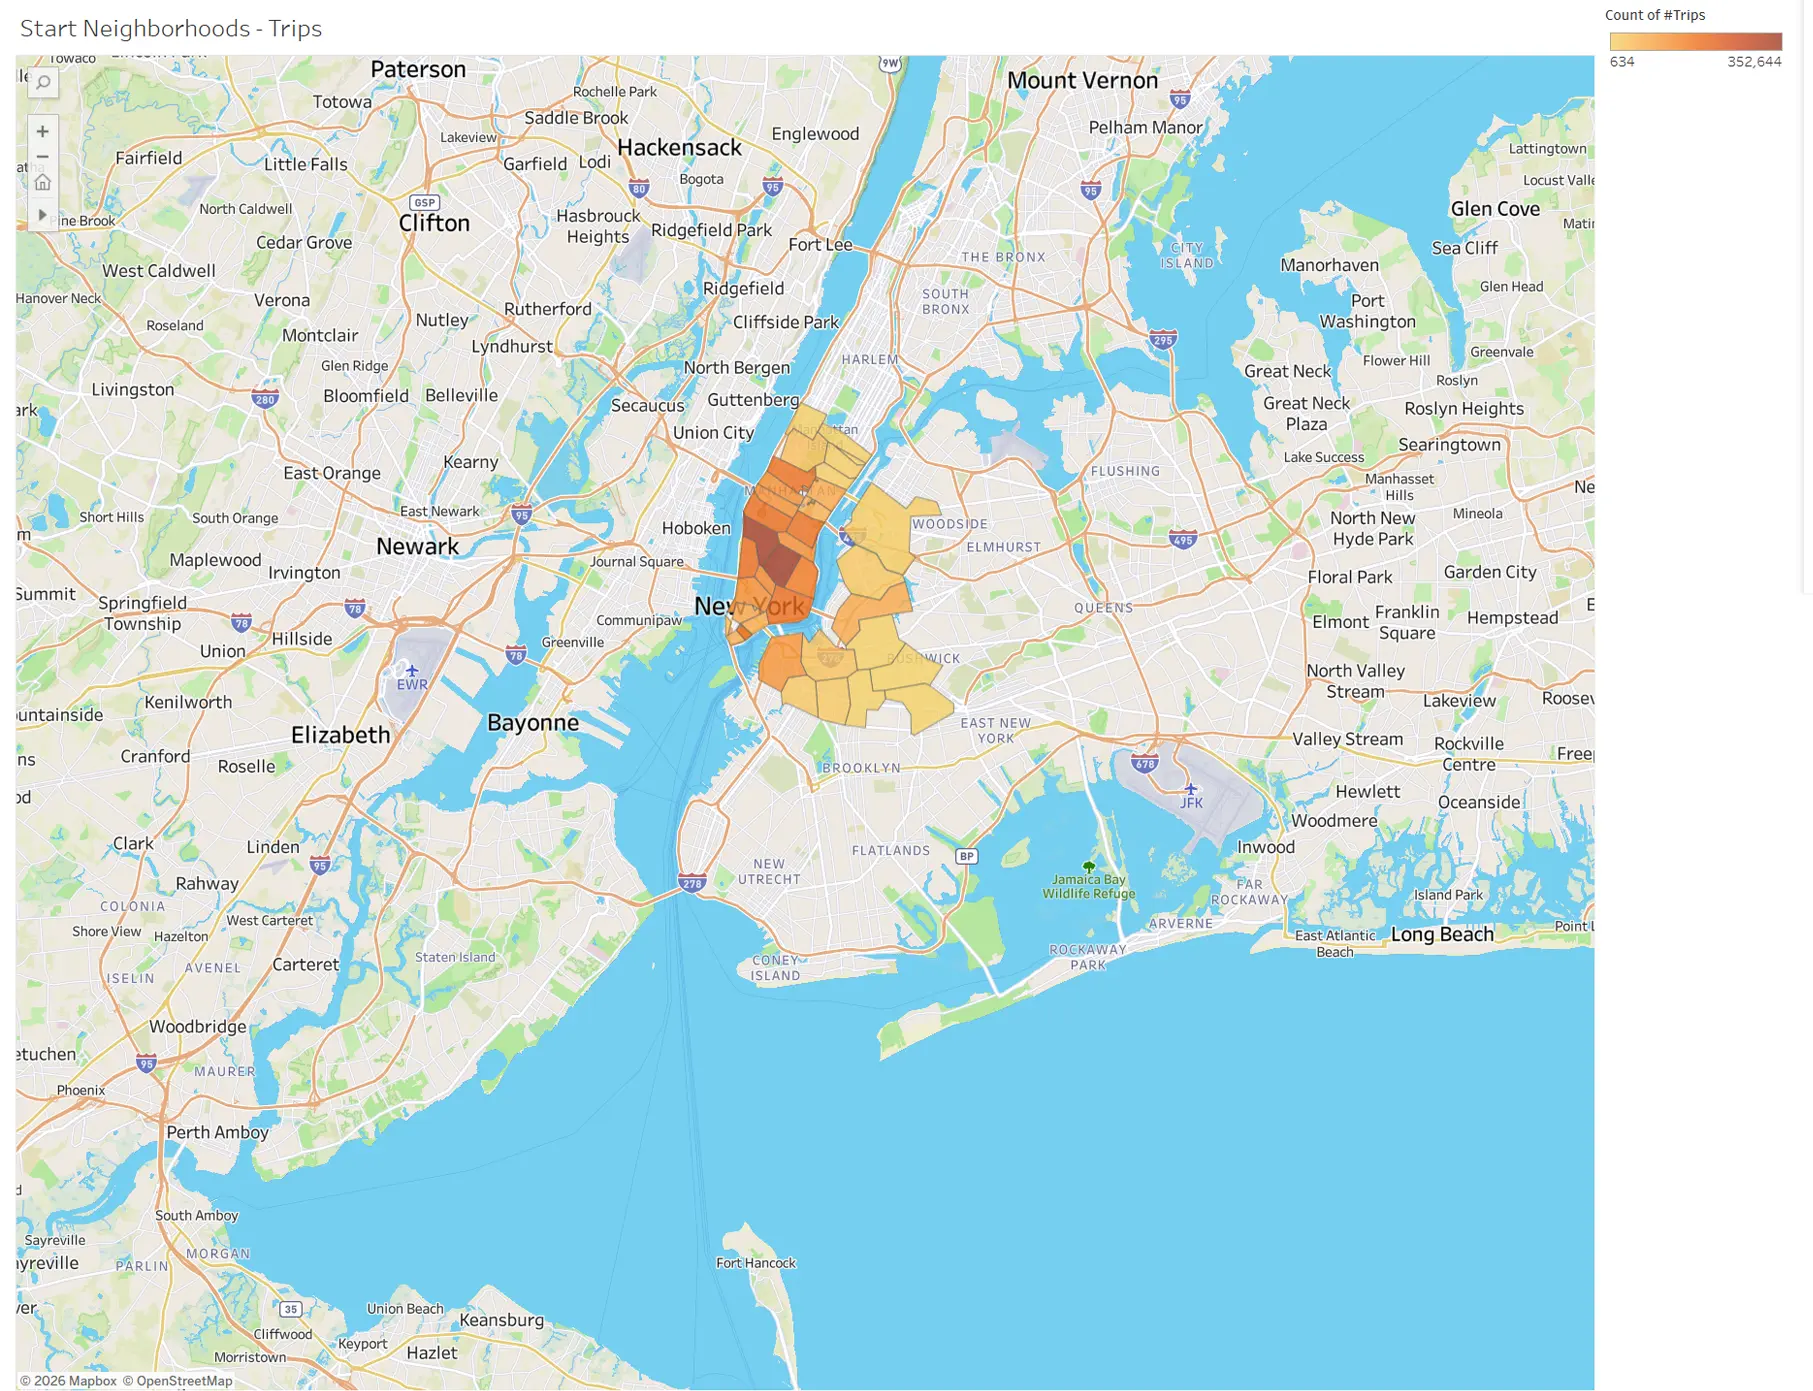
Observation 1: Volume vs. Duration Across Neighborhoods
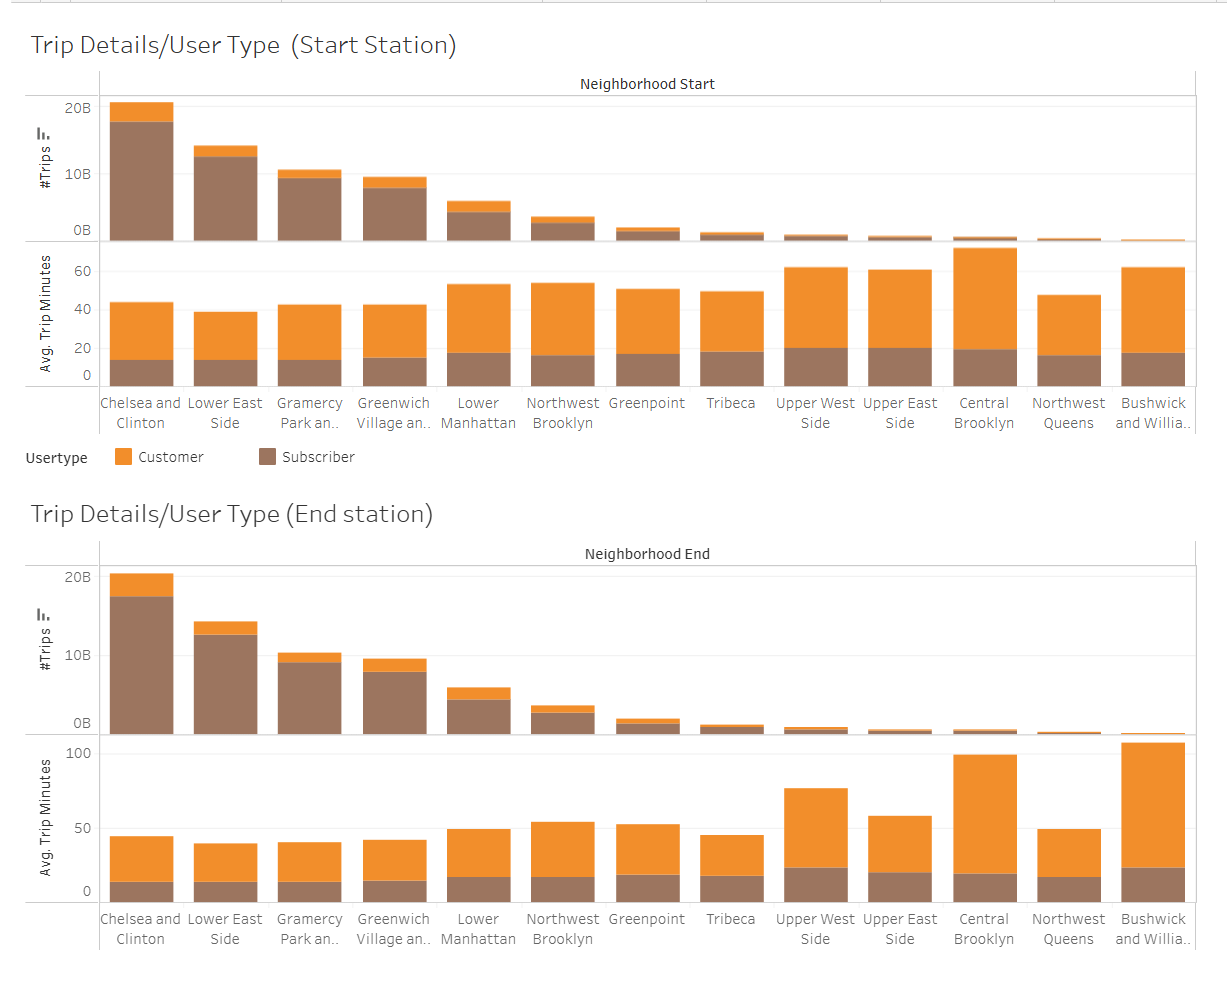
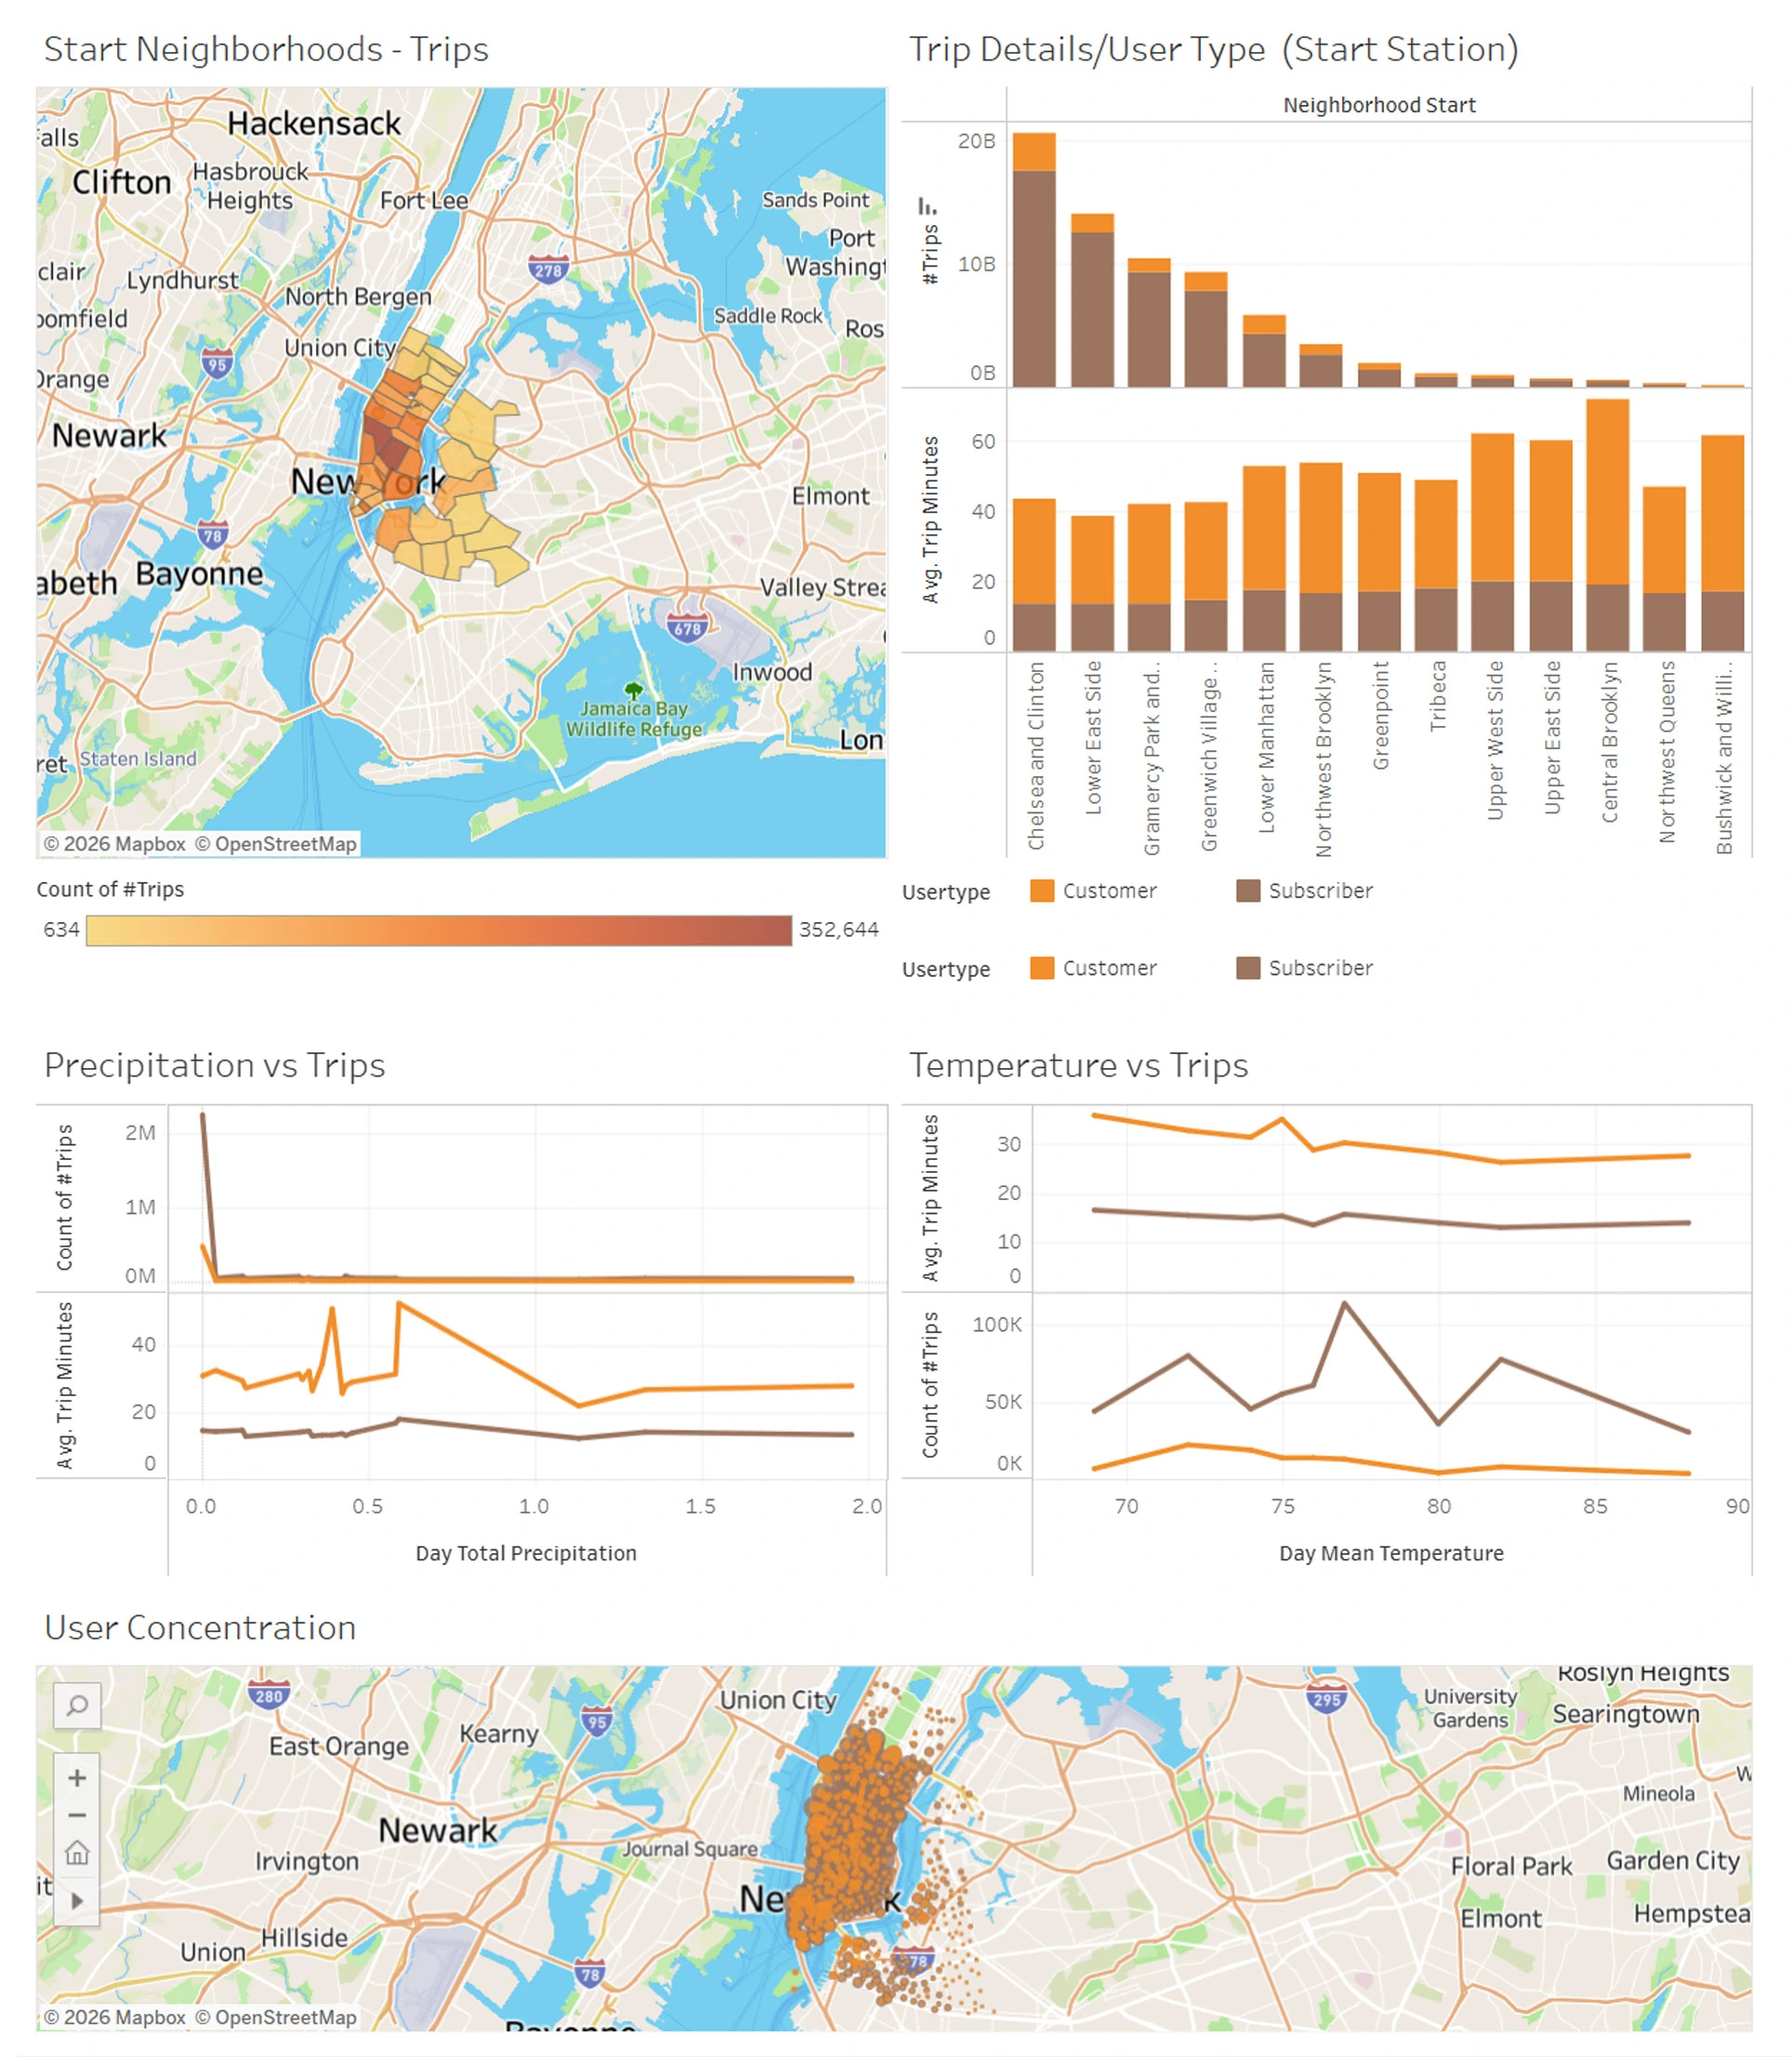
✓ An inverse relationship exists between total trip volume and average trip duration.
✓ Neighborhoods with high trip counts display lower average trip durations, whereas neighborhoods with low trip counts exhibit significantly longer average trip durations.
✓ Manhattan dominates overall trip volume, while Brooklyn leads in average trip duration.
Observation 2: Regional Demographics & Customer Segments
✓ Manhattan shows a heavy concentration of Subscribers, who use bikes frequently for short, routine commutes.
✓ Brooklyn exhibits a higher proportion of non-subscribing Customers, who use bikes on an ad-hoc basis (e.g., leisurely rides on pleasant weather days or during traffic congestions), resulting in longer ride durations per trip.
Observation 3: Weather Sensitivity
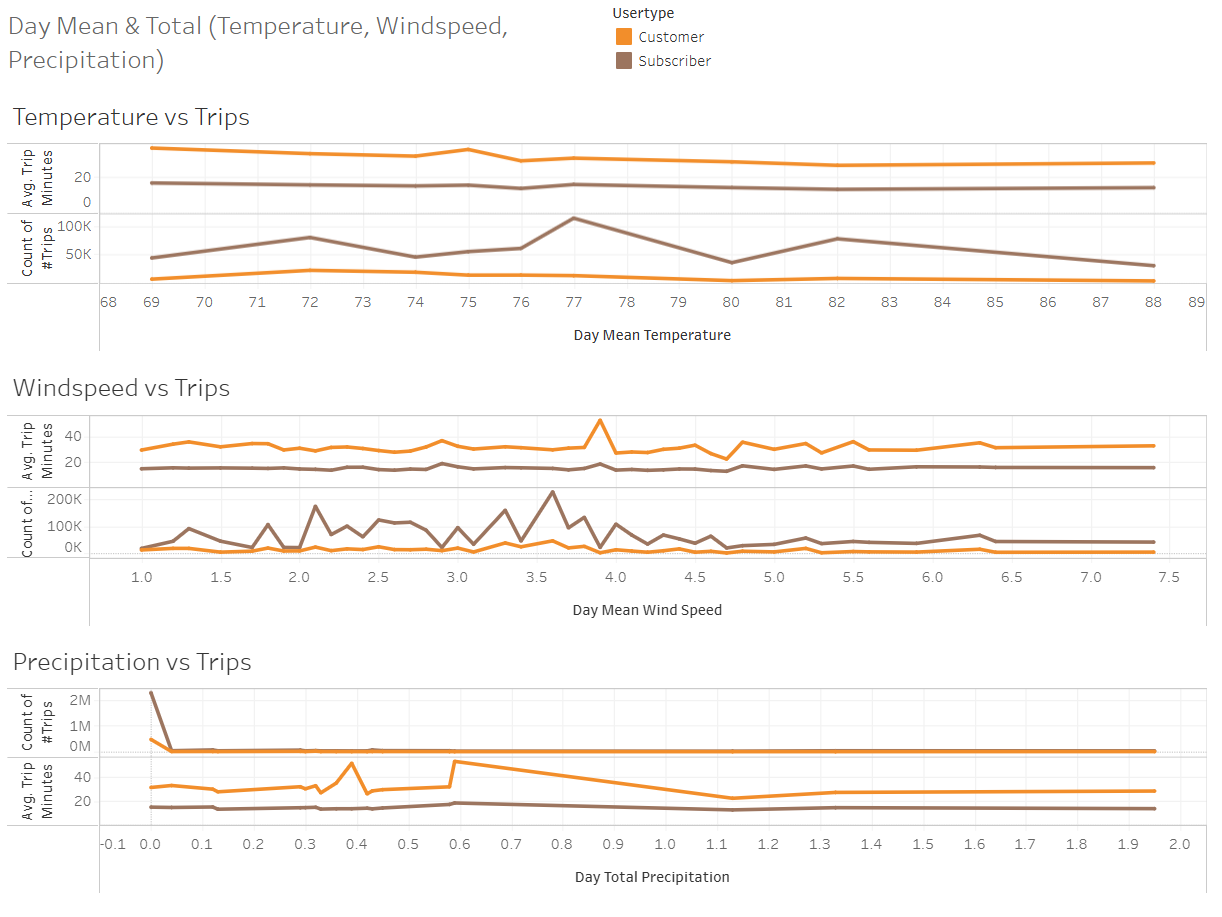
✓ Higher daily temperatures positively correlate with increased trip volume, particularly among non-subscribers.
✓ Factors like wind speed and precipitation had minimal impact on trip variances and do not warrant dedicated marketing adjustments.
Observation 4: User Behavioral Patterns
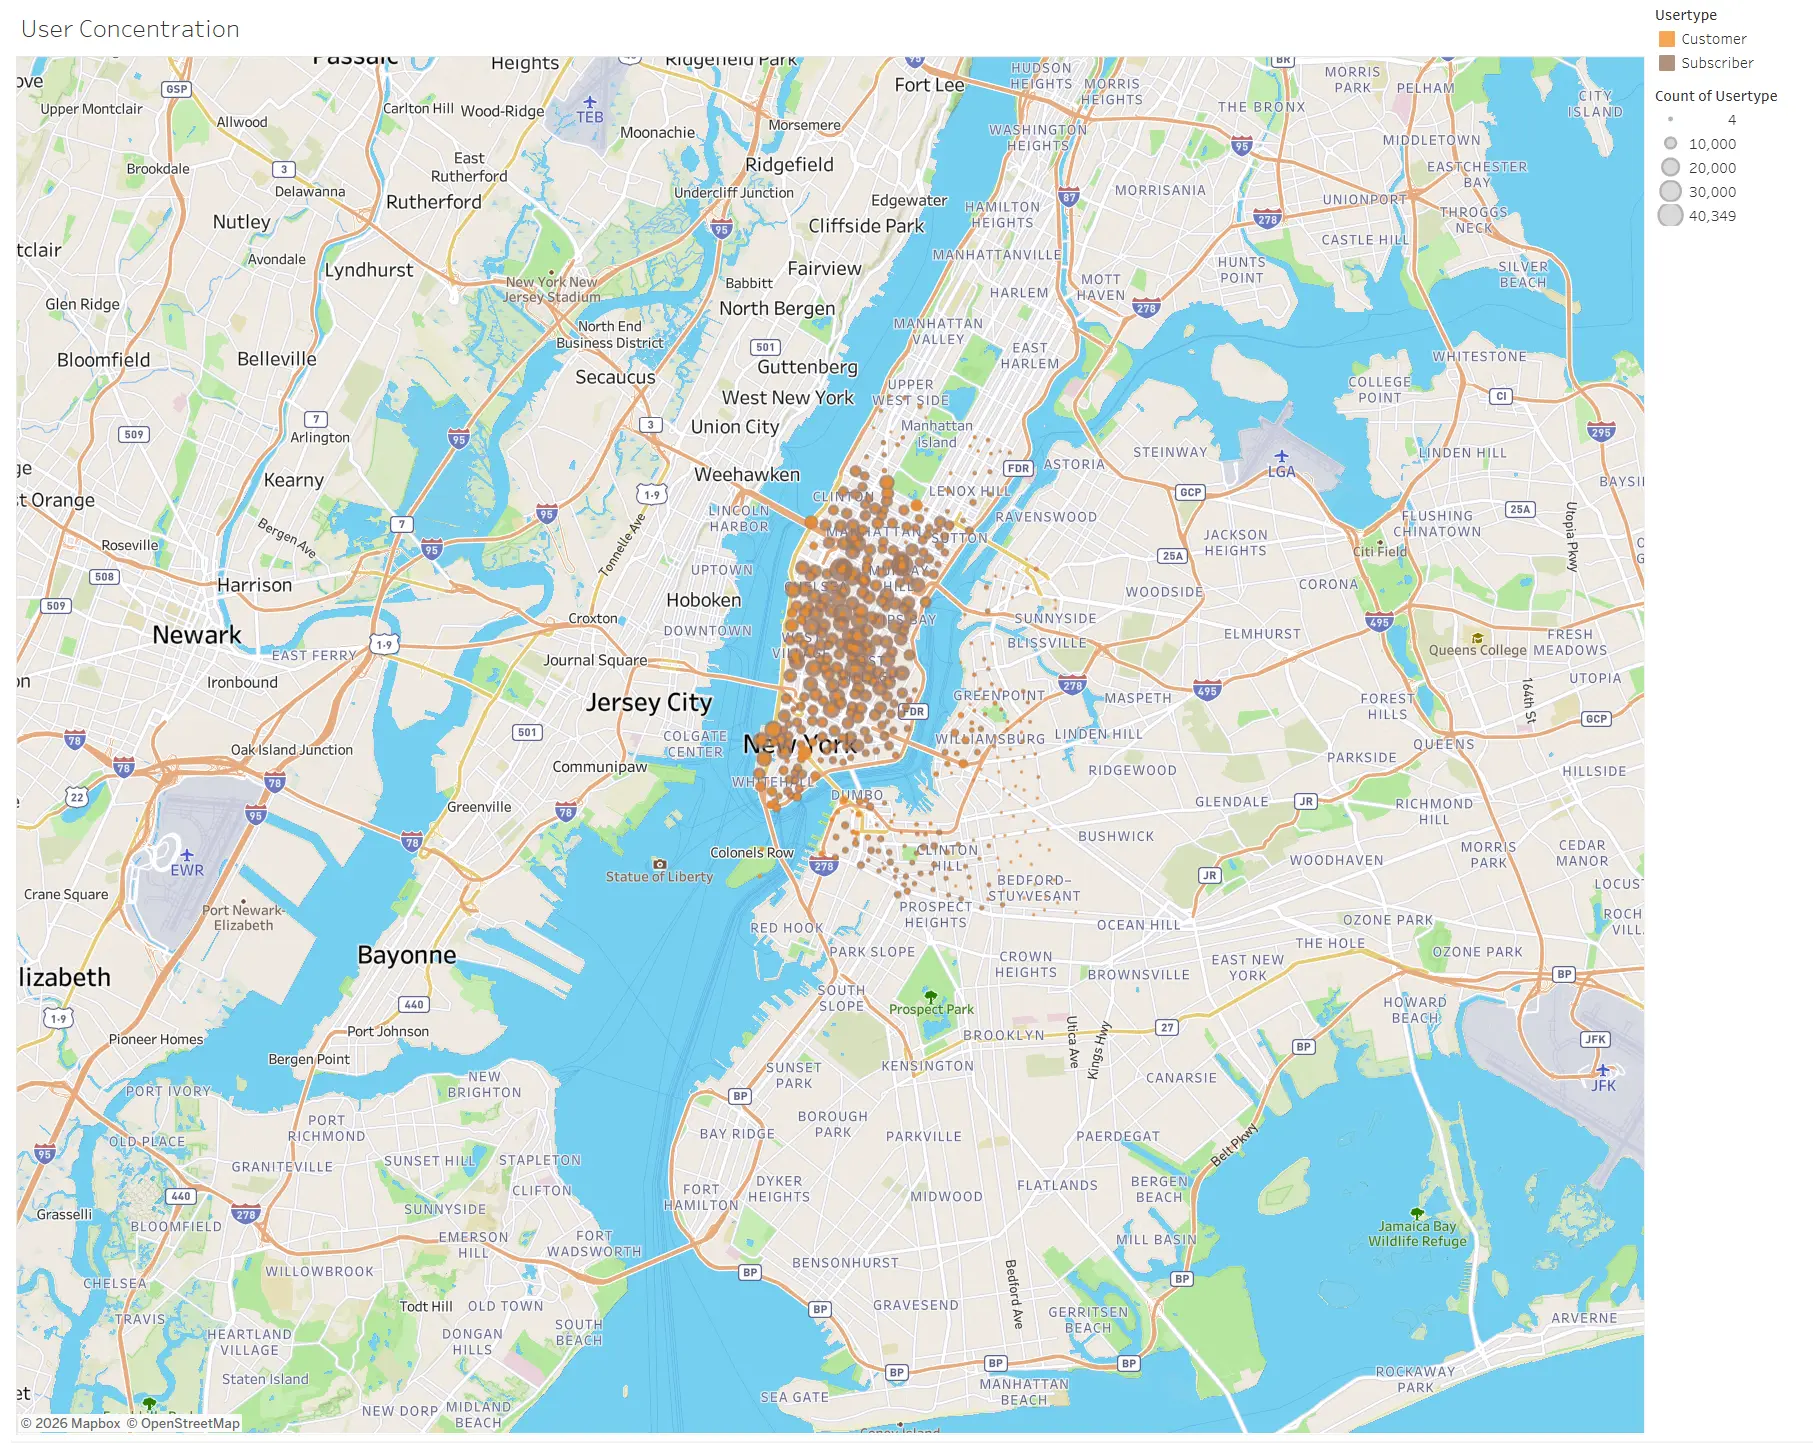
✓ Mapping starting and ending stations by user category confirms that Subscribers commute regularly for shorter durations, whereas non-subscribing Customers utilize the service intermittently for longer, recreational journeys.
Observation 5: Station Pair Utilization
✓ Analysis of popular starting-to-ending station pairs highlights key transit corridors.
✓ While full network expansion cannot be recommended without station capacity data, high-volume station pairs serve as immediate targets for inventory rebalancing.
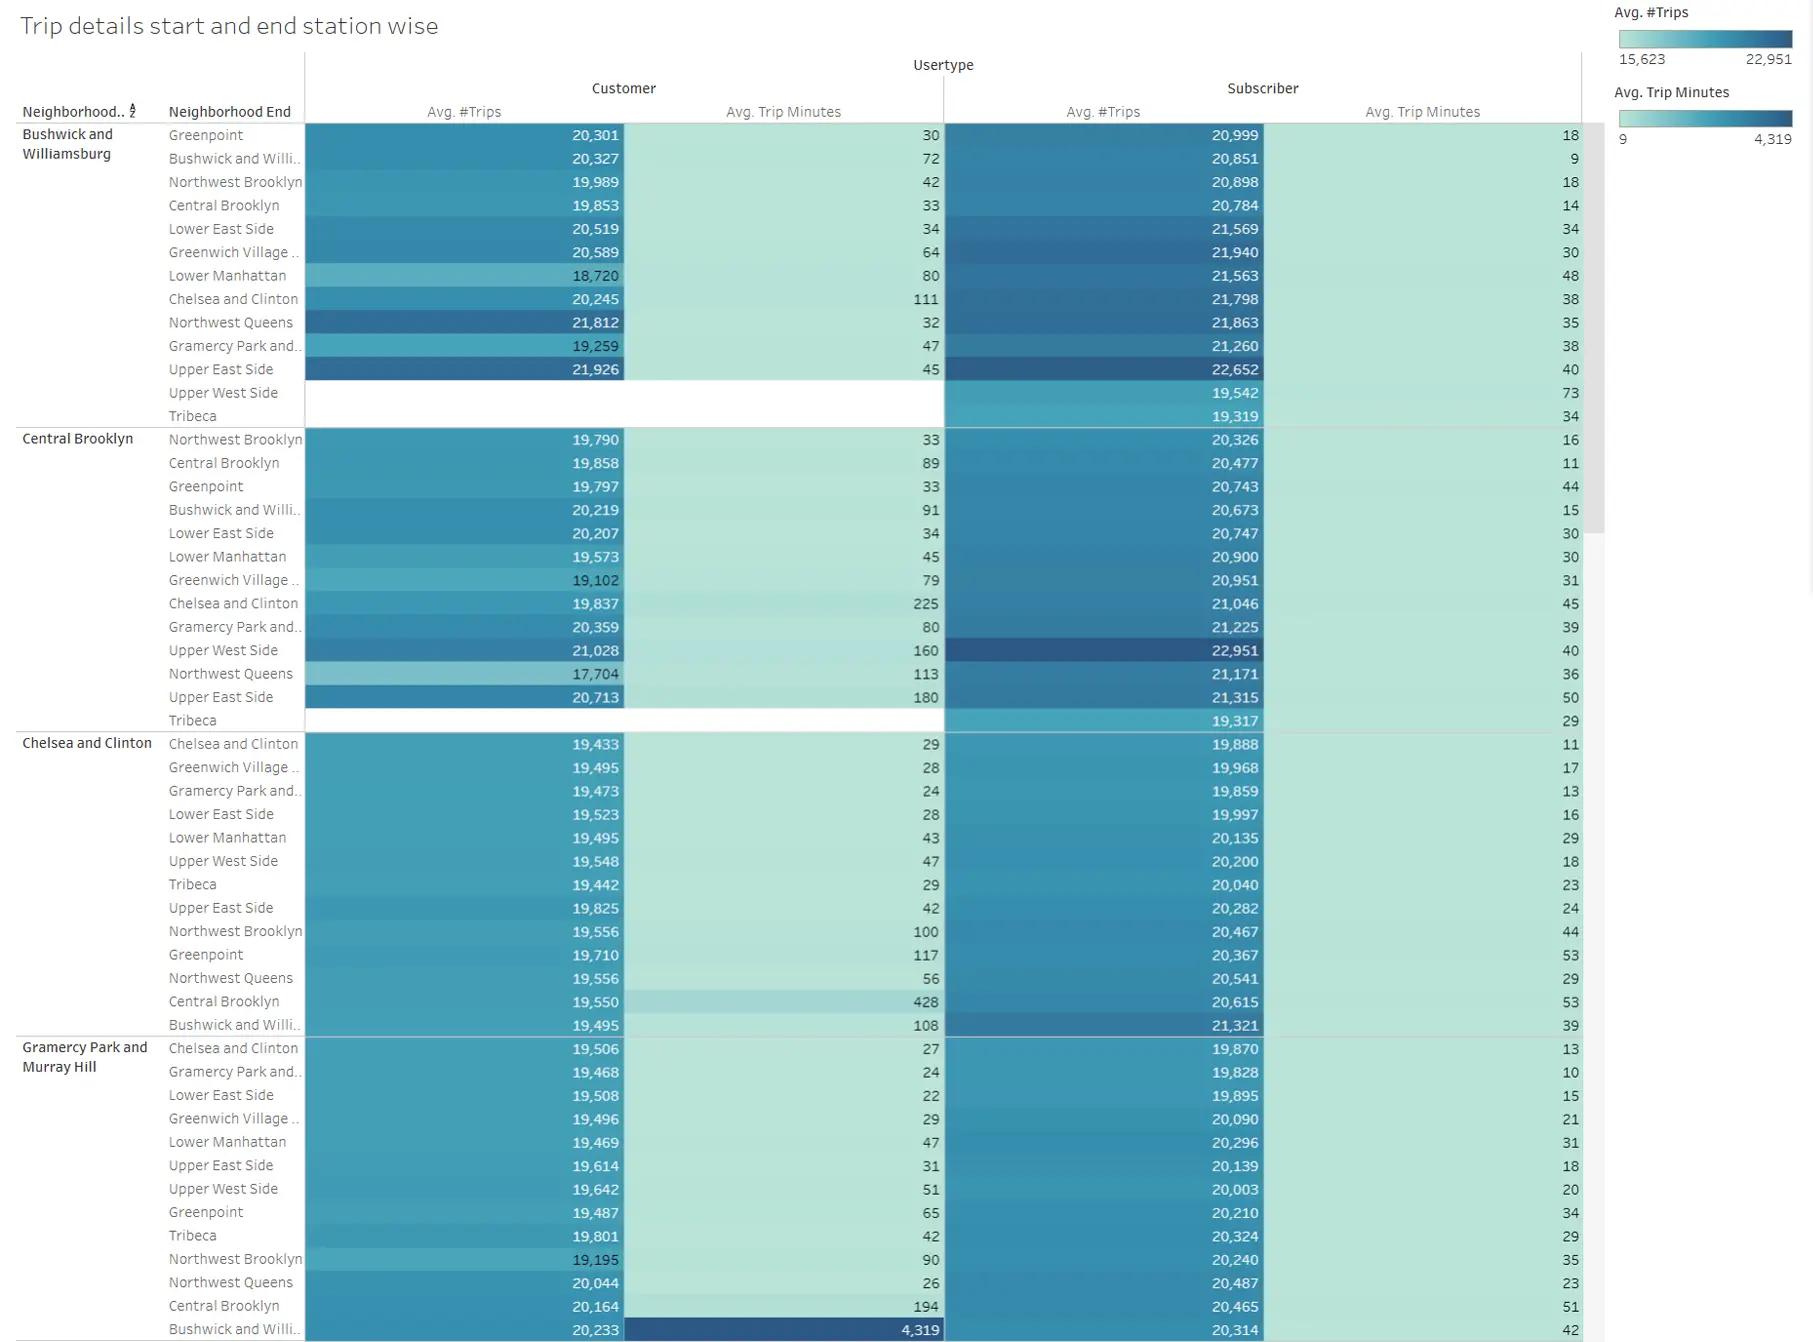
Tableau Dashboard Visualization
See this dashboard live : Click here
Recommendations
✓ To maximize value capture from the high-frequency subscriber base, Cyclistic should transition to a tiered pricing structure that incorporates a base flat fee covering initial ride limits, followed by incremental per-minute or per-mile charges for extended trips. To prevent subscribers from exploiting time limits by docking and immediately re-keying bikes mid-journey, utilization tracking must be enforced strictly at the unique user ID level rather than the bike ID level. Over time, management can incrementally raise this baseline flat fee to maximize revenue from daily commuters who rely on the service.
✓ Marketing strategies for non-subscribing casual riders should focus on distance-based incentives and automated, weather-triggered engagement. Cyclistic can introduce extended-duration or long-distance discounts to better appeal to casual riders in Brooklyn who take fewer but noticeably longer journeys. Additionally, the team should leverage weather data to launch real-time push notifications on high-temperature, clear-sky days, driving spontaneous casual user activation during optimal leisure conditions.
✓ Cyclistic must prioritize inventory rebalancing along high-volume corridors over immediate physical network expansion. Delivering real-time bike availability notifications through the mobile app during peak morning and evening commute hours will help capture active demand and reduce user friction. Concentrating rebalancing efforts on the highest-trafficked station pairs will ensure consistent fleet availability where ride volume is densest.