
Cyclistic Bike-Share (Data Analytics Capstone)
My another capstone project for the Google Data Analytics Professional Certificate. This case study serves as a culmination of the program, applying end-to-end data analysis to solve a real-world business challenge using the six-phase methodology: Ask, Prepare, Process, Analyze, Share, and Act.
Stepping into the role of a Data Analyst on Cyclistic’s marketing team, my primary objective was to analyze customer usage patterns to understand how annual subscribers and casual riders (single-ride and daily pass users) interact with the service differently. These insights directly inform a targeted marketing strategy designed to convert casual riders into long-term annual members.
About the Company
Cyclistic is a premier bike-share program featuring a fleet of over 5,800 bicycles and 600 docking stations. Cyclistic sets itself apart through inclusivity, offering not only standard two-wheeled bikes but also reclining bikes, hand tricycles, and cargo bikes to accommodate riders with disabilities and varying physical needs.
Business Task
Analyze historical ride data to uncover how annual members and casual riders utilize Cyclistic bikes differently. The ultimate goal is to deliver data-driven insights that inform targeted marketing strategies aimed at converting casual riders into long-term annual subscribers.
Key Stakeholders
✓ Lily Moreno (Director of Marketing): Responsible for leading marketing initiatives and campaign development across email, social media, and digital channels.
✓ MarketingAnalytics Team: A dedicated team of analysts responsible for gathering, processing, analyzing, and presenting data to guide overall marketing strategy.
✓ Executive Team: A detail-oriented leadership team responsible for reviewing analysis results and approving final marketing proposals.
Data Integrity & Credibility
Cyclistic is a fictional entity created for this case study. The underlying data is authentic public bike-share data made available by Motivate International Inc. under an open-data license agreement. The datasets are appropriate, timely, and scrubbed of personally identifiable information (PII) to ensure user privacy and maintain data integrity.
Data Cleaning and Analysis in SQL
Here are the steps that I followed during this phase:
✓ Combined all the tables into one data table
✓ Check for null and duplicates
✓ Cleaned the data
✓ Additional columns and data transformation
✓ Extract data for analysis
Tableau Dashboard for visualization
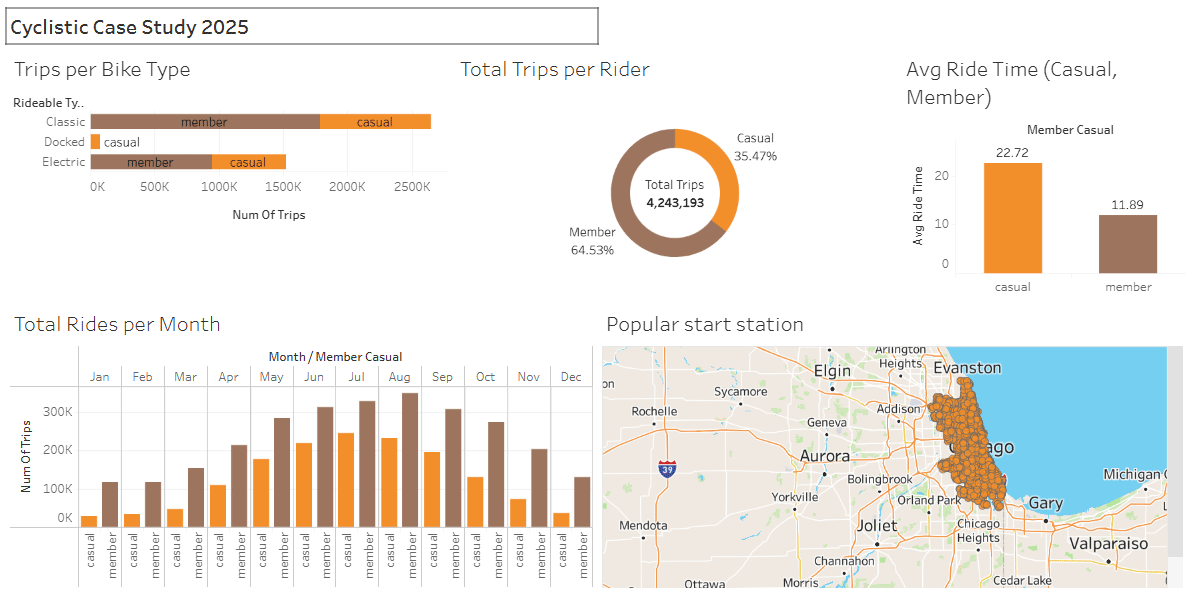
See this dashboard live : Click here
Key Conclusions
✓ Annual members make up 64.53% of total trips, providing a strong, reliable core of recurring ridership.
✓ Members primarily use the service for daily commuting, evidenced by higher weekday trip counts and shorter ride durations (~12 minutes). Casual riders use the service for leisure, showing strong weekend activity and longer ride times (~23 minutes).
✓ Overall ridership surges significantly during the summer months (June–August) due to favorable weather, with casual rider volume showing the highest sensitivity to seasonal changes.
Recommendations
✓ Launch digital and email marketing campaigns specifically geared toward casual riders, emphasizing the cost savings, speed, and convenience of an annual subscription over single-ride passes.
✓ Place physical and digital advertisements at top casual start stations—particularly those near coastal areas, parks, and tourist hotspots, featuring scan-to-subscribe QR codes for instant sign-ups.
✓ Capitalize on peak summer traffic by offering limited-time conversion promotions (e.g., discounted first-year annual rates or "Summer Special" member perks) when casual usage is highest.
✓ Promote the reliability and availability of classic bikes, the top choice for both user groups, by offering exclusive member perks, such as primary access or rewards points for frequent commuters.